
Power BI is a business analytics tool used for analyzing, visualizing and publishing data. It is part of Microsoft’s Power Platform which includes PowerApps, Microsoft Flow & Power BI. A tool which helps you to convert data from various sources into interactive dashboards and reports, it also provides multiple software connectors and services.
Power BI has different versions like Desktop, Service – Based (SAAS), and mobile Power BI apps, which are used for different platforms.
In this Power BI blog, you will learn concepts, use – cases, importance of Power BI and develop a basic understanding of how to use Power BI tool.
WHY are businesses using Power BI, thriving at a faster rate?
Power BI provides the following features which makes it easy to build and consume information even to the CxO level people in the organisations.
- Allows real-time dashboard updates.
- Offers secure and reliable connection to your data sources on the cloud or on-premises
- Offers Quick Deployment, Hybrid Configuration, & Secure Environment
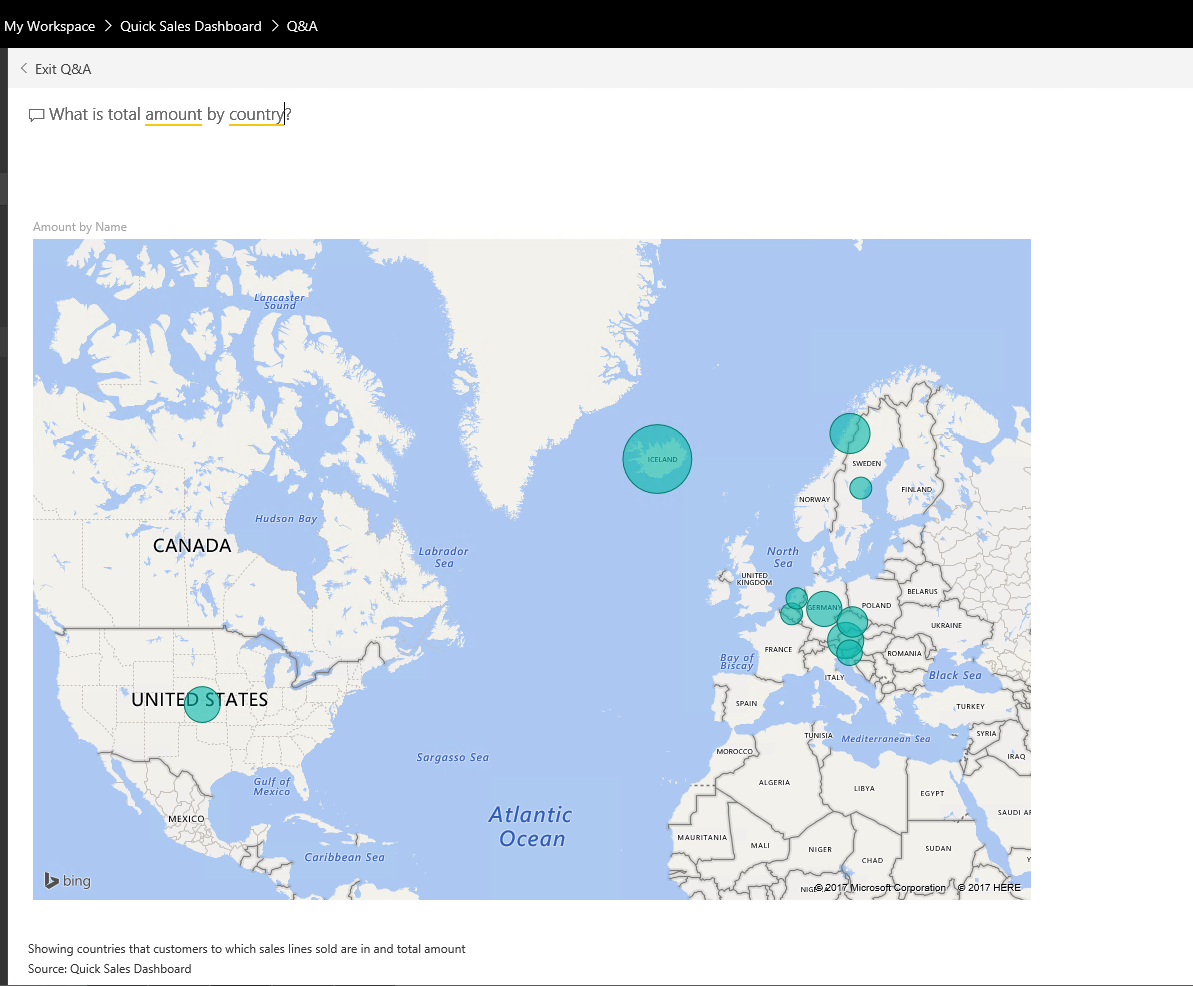
- Allows data exploration using natural language query
- Offers features for dashboard visualization regularly updated with the community
Different types of Power BI tools
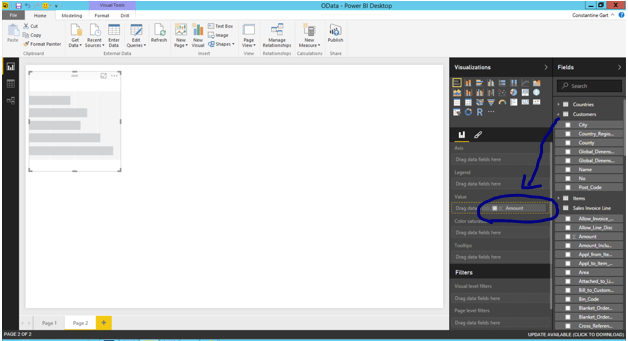
Power BI Desktop – Power BI desktop is the primary authoring and publishing tool for Power BI. Developers and power users use it to create brand new models and reports from scratch. It costs Free.
Power BI Service – Online Software as a Service (SaaS) where Power Bl data models, reports, dashboards are hosted. Administration, sharing, collaboration happens in the cloud. This costs $ 10 per user per month.
Power BI Data – Power BI Data Gateway works as the bridge between the Power Bl Service and on-premise data sources like Direct Query, Import, Live Query. It is Installed by Bl Admin.
Power BI Report Server – The users can modify Power Bl reports other reports created by the development team.
Power BI Mobile Apps – Power BI mobile app is available for iOS, Android, Windows. It can be managed using Microsoft Intune. You can use this tool to view reports and dashboards on the Power Bl Service Report Server.
Let us now look at some key terms which are used in Power BI –
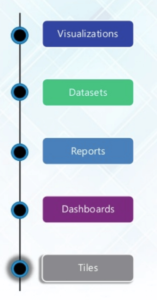
| Visualization | A visual display of information to achieve one or more objective. It offers a single screen display of information. It alerts users on issues like Operational, Performance, Personal, etc. |
| Datasets | A dataset is something which you import or connect to. Datasets can be renamed, refreshed, removed, and explored |
| Dashboard | The dashboard is a collection which contains no or more tiles and widgets. It is used to represent a customized view of some subset of the underlying datasets. |
| Reports | A Power BI report is one or multiple pages of visualizations. It can be created from scratch, imported to a dashboard, and created using datasets. |
| Tile | It is a single visualization found in a report or on a rectangular dashboard box which contains each visual. |
With this we come to our next topic where we will see the architecture of Power BI
Power BI Architecture
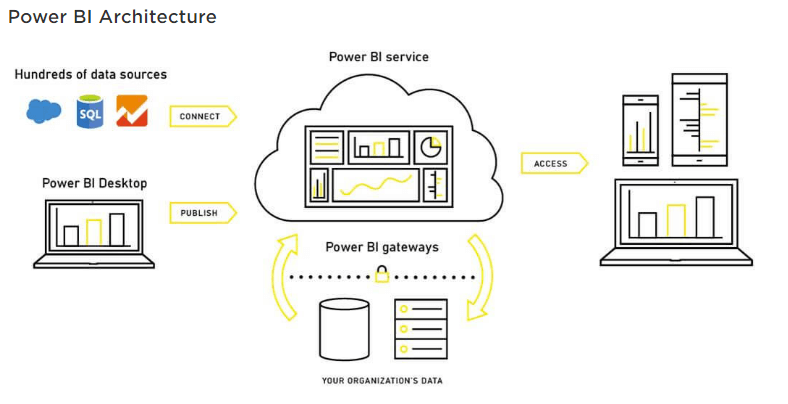
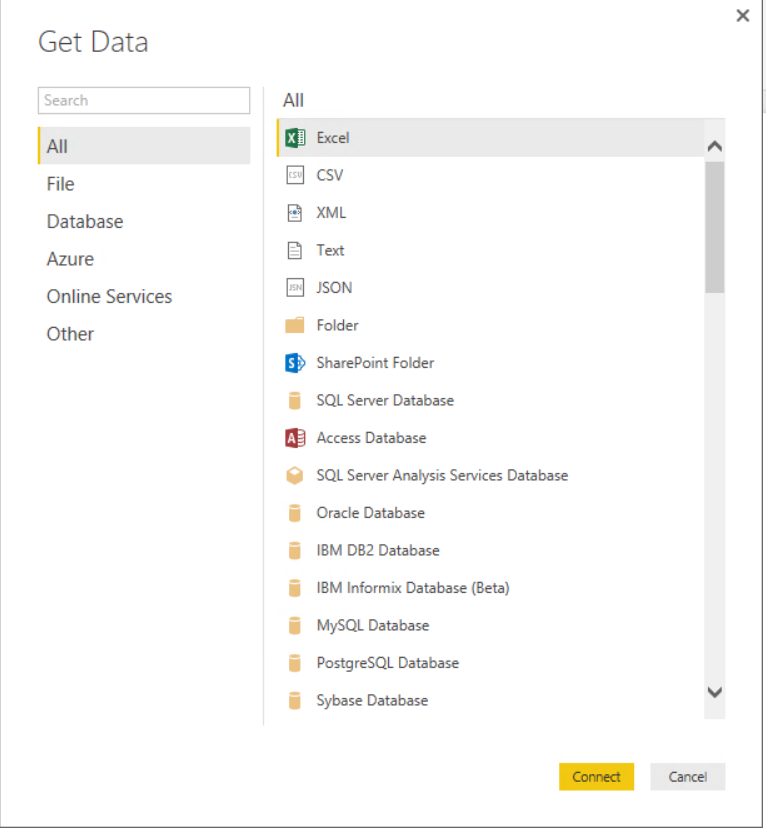
Data Integration – An organization needs to work with data which often comes from various sources and in various formats. The data needs to be extracted from different sources which can be from different servers or databases. This data is then integrated into one standard format in a common staging area.
Data processing – In this stage, the integrated data is still not prepared for visualization as the data needs processing. This data is pre-processed. For ex, redundant values, missing values will be removed from the data set.
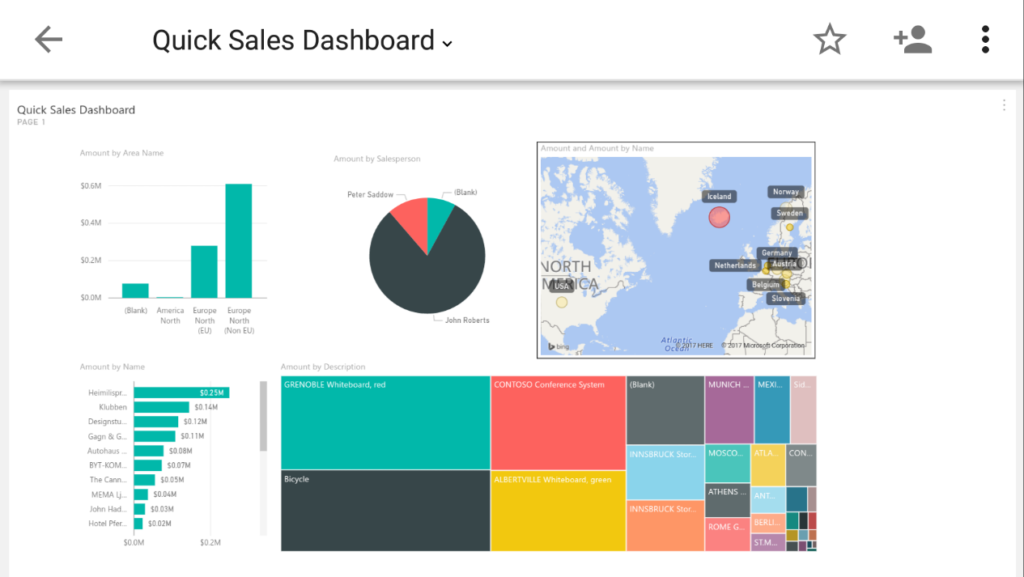
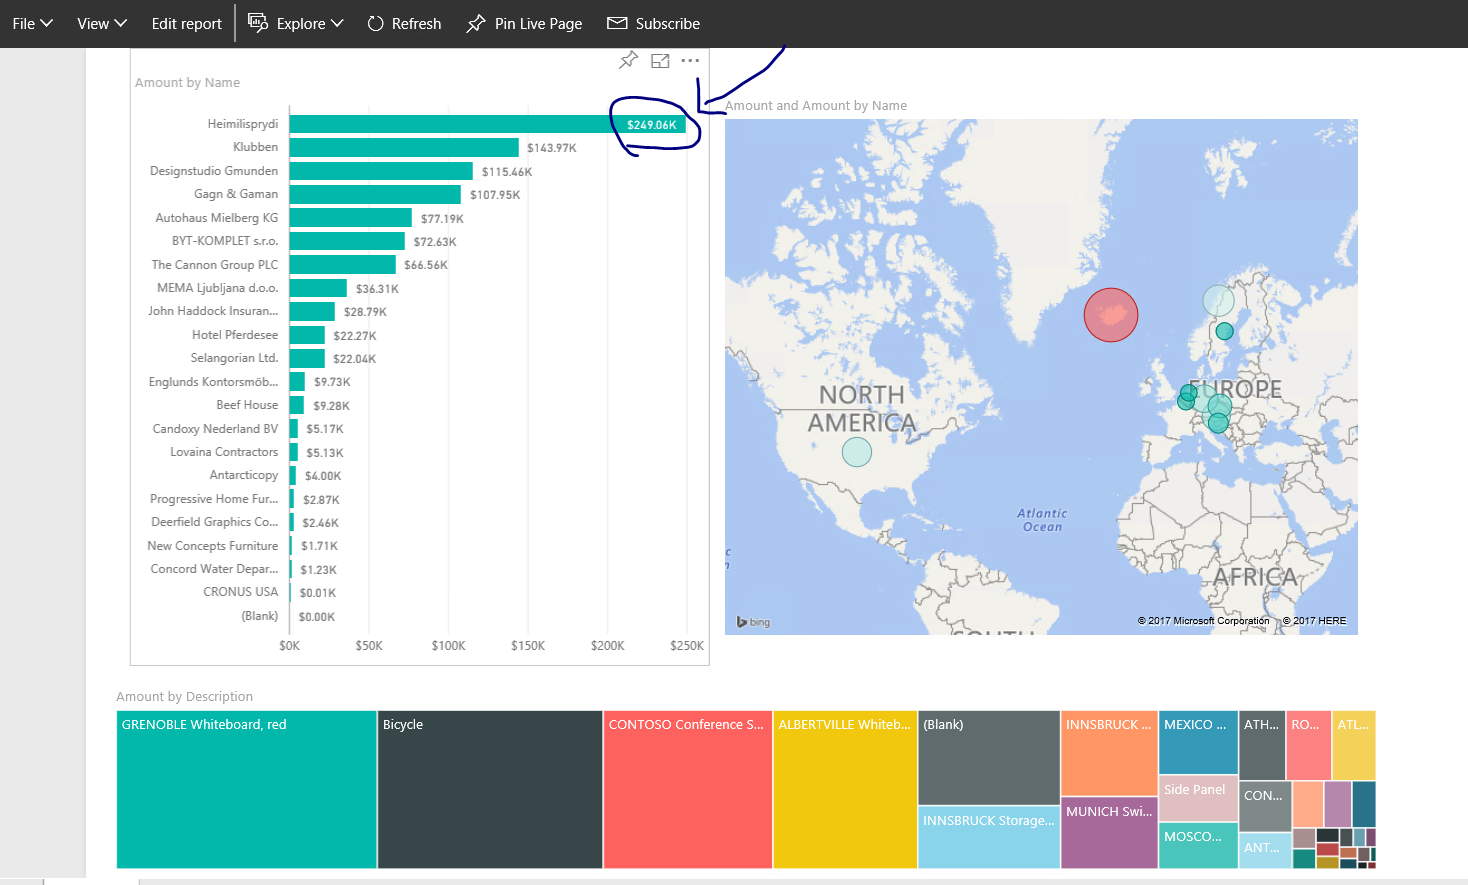
Data Presentation – Finally, when the data is loaded and processed, it can be visualized much better with the use of various visualization techniques that Power BI has to offer. Use of dashboard and report helps one represent data more intuitively. This visual report helps business end user to take business decision based on the insights.
Now that, everybody has a clear understanding as to the basics of Power BI, let us also look at the importance of Power BI in the Industry. Power Bi is a powerful analytics tool that helps companies of all sizes analyze data and share insights. With this technology, enterprises can monitor their business more closely and get instant answers with rich dashboards available for every device.
Importance –
- Minimal upfront costs
- View Power BI reports across multiple platforms and devices
- Consolidate multiple data sources through Power BI.
- Instantly share dashboards
- Drag-and-drop functionality
- Drill-down functionality
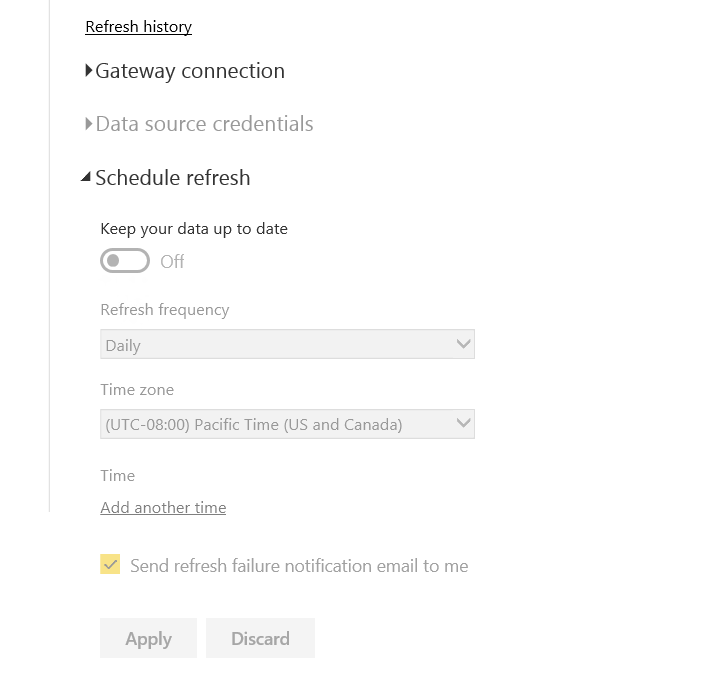
- Schedule Data Refresh
- Write simple sentences to run report queries
- Growing Power BI online community
In the next blog, we will look at how to create the reports and dashboards and get started working with Power BI.
Comments (2)
AffiliateLabz / February 15, 2020
Great content! Super high-quality! Keep it up! 🙂
JamesSmics / April 29, 2020
Thanks for providing many of these good posting.
Comments are closed.